Finance and Operations come at procurement from opposite ends. RiskOpex gives them a single framework: the same financial terms, set before the decision and on record after.
Present the case in terms Finance and Operations understand and support.
The job is taking the right risks, managing uncertainty and being able to measure the benefits.
The right outcome for your team, justified.
For the business
Decisions based on the whole business and bottom line, not limited to a silo.
Consistent decisions quantifying uncertainty, across sites and teams, in one framework.
A clear financial picture of control cost effectiveness.
Complex decisions. Clear options.
Three real examples, re-modelled with public data.
◈
RiskOpex
To avoid $5M in wear and a risk that went unquantified, the de-rate cut output by $250M.
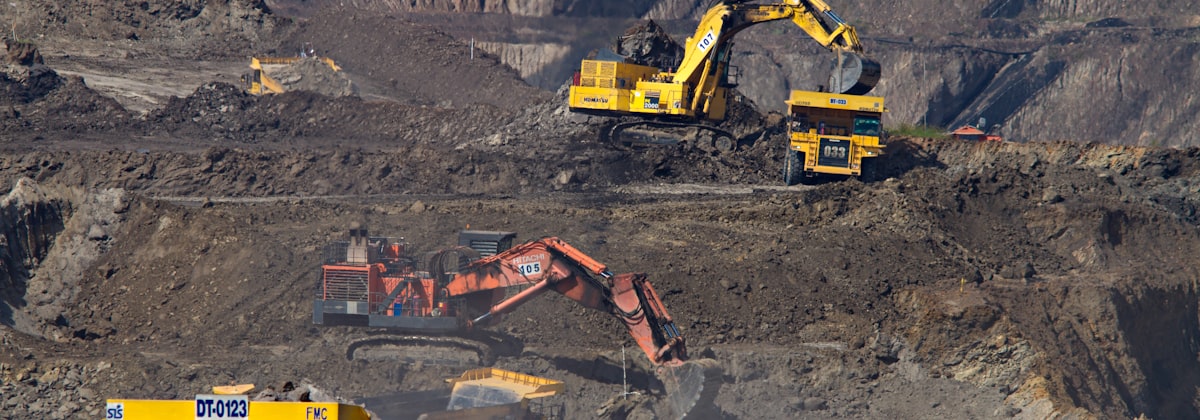
A Cat 789 fleet, configured to underperform. KPIs measuring faults and maintenance drove strong protections costing production. The fix was framed as avoiding faults, with no numbers put on how likely they were, or what they'd cost. Set against that: the de-rate gives up $250M a year, for certain; restoring spec costs $5M of wear plus a small fault risk. Even in the worst plausible year, the fix costs a fraction of the de-rate.
Keep the de-rate
Restore OEM spec
Certain each year
$250M revenue forgone
$5M extra wear
At risk each year
—
$3.75M 5 faults, expected
Worst plausible year
—
$13M 11 faults, 1-in-100
Net average vs today
—
$241M a year better
The de-rate weighed a $5M wear cost against a fear of faults — with neither the odds of those faults nor the output it gave up ever put in numbers. Measured, restoring spec pays even on the pessimistic forecast; in the event, the faults never came.
◈
RiskOpex
Two operating models, one noisy and predictable, the other quiet and high risk. Which costs more?
Smart infrastructure with remote support genuinely reduced minor outages and saved about $18K a year of business interruption. But it removed the on-site repairs that keep a control outage from outlasting manual control — doubling the odds of a $1B freeze, from 1-in-200 to 1-in-100. The case was decided on the $20K line. The billion-dollar line was left off the table.
Standard, on-site IT
HA, remote support
HA, specialists on site
Certain each year
$242K
$669K
$969K
Everyday outages what the case was argued on
$20K 6 a year
$2K cut to 0.5 a year
$2K cut to 0.5 a year
The freeze what decides it
$5M 1-in-200
$10M 1-in-100, doubled
$5M 1-in-200
All-in each year
$5.2M
$10.7M
$6M
The vendor that took the world down offers 50% off.
Is that even the question?
◈
RiskOpex
The vendor that took the world down offers 50% off.
CrowdStrike offers a 2,000-user company 50% off a three-year contract after the July 2024 outage: $164K a year less. Microsoft's security tier, already partly paid for, covers every device for $210K a year less than today — comparable risk, and no add-on software stack impacting availability. The offered discount doesn't reflect the complete risk position.
CrowdStrike, list
CrowdStrike, 50% off
Microsoft, EDR all
Microsoft, no EDR 1,500
Certain each year
$500K
$336K
$275K
$181K
At risk each year
$245K
$245K
$260K
$403K
Worst plausible year
$2M breach 1-in-30 + $750K outage 1-in-30
$2M breach 1-in-30 + $750K outage 1-in-30
$2M breach 1-in-30
$12.5M breach 1-in-60
Net vs today
—
$164K better
$210K better
$161K better
What you walk away with.
Control spend you can defend
See which controls earn their keep and which are dead spend
One picture across your sites
The same method, the same answer, wherever you operate
Decisions justified
The rationale is on record before the outcome is known
Not for compliance — for the business.
Box-ticking doesn't protect the business. Here is what risk management looks like when it isn't doing its job:
Inconsistent decisions across sites
Same risk, a different answer site to site
Risk matrices that don't help you decide
A grid of colours won't tell you what to do
Risk-control spend you can't defend
Real money committed, no proof it was the right call
Who's behind RiskOpex.
Paul Young
Co-founder & Chief Technology Officer
25+ years in mining, risk, and digital transformation. Rio Tinto, Newcrest Mining, and Centerra Gold, across operations in PNG, Australia, Fiji, Canada, USA, Türkiye, Indonesia and Kyrgyzstan.
Johannes Chudoba
Co-founder & Chief Strategy Officer
30+ years called in to fix what others couldn't in Croatia, Bosnia, Afghanistan, Nigeria, and a dozen more. From 2014, in mining: strategic planning, risk and digital transformation for Centerra Gold in Kyrgyzstan and Türkiye.
Ready to see it work with your data?
30-minute walkthrough. No pitch deck. Just the product, your scenarios.